Do you spend hours trying to figure out what works best on Instagram? Maybe you check the amount of likes a photo gets or keep an eye on how many followers you have, but there’s so much more data at your fingertips just waiting to take your grid stratospheric… Enter Instagram Insights.
Long gone are the days when you have to second-guess your IG success (phewf for that). Whether you’re curious to know when to post or wonder which Stories perform best, Instagram Insights will help to develop a strategy that makes deciding what to share easy-breezy.
Let’s be real: engagement matters. With the all-mighty algorithm dictating which posts surface on your followers’ feed, it’s time to get geeky. Rather than being boring, the stats will save you time as well as stress, ramp up your engagement and attract new followers. Sounds sweet, right? Right.
In this lesson, we’ll focus on how to use Instagram Insights with the hope of empowering you to regularly dive into the data and keep you at the top of your (Insta)game. Ready to roll? Let’s do this!
What exactly is Instagram Insights?
Instagram Insights is basically just Instagram Analytics. The Insta-gods have made it super easy to keep track of your numbers thanks to the analytics tool that is filled to the brim with handy info and sits conveniently within the app itself. Instagram Insights is really simple to use, with easy to understand charts that drill into everything from top posts to the location of your followers.
What’s great is you know the data is 100% reliable because it’s coming from the horse’s mouth. Plus, you’ll be getting the stats while saving your pennies because it’s free to use as opposed to splashing out on a separate (and sometimes costly) analytics tool.
But don’t just take our word for it. Top content creators have told us that they use Instagram Insights on repeat to inform their content strategy. “Before brands will work with influencers on paid partnerships, they need to determine ROI [ie: return on investment]. This is when Instagram Insights becomes my best friend,” says Sarah Daniels of the brilliant @globetrotting_minis. “Numbers don’t lie! They instantly tell a potential client how well my content performs, which will determine a deal or no deal. At the end of a campaign, these stats can deliver evaluation metrics to the client too and that makes for a nice wrap-up. ”
“Numbers don’t lie! They instantly tell a potential client how well my content performs, which will determine a deal or no deal.” – @globetrotting_minis
How to view Insights on Instagram
Heads up: to use Instagram Insights, you need to have a business account.
Making the switch is pretty straightforward (if you haven’t already). Go to your IG profile and choose “Settings” in the sidebar next to the little gear icon. Tap on “Account” and you’ll see an option called “Switch to Business Account.” You’ll be asked to connect to an official FB page, add in the contact details you want to appear on your profile and you’re done. Hello, business you!

Now, when you tap the “Insights” option at the top of the sidebar menu on your Instagram profile, you’ll see a breakdown of your account’s analytics. The platform initially offered some pretty basic numbers, but it’s constantly expanding to show you deeper insights. And there’s no doubt it’ll only get bigger and better.
As blogging superstar @iamkristabel tells us, it’s nifty to have so many stats in your Insta armoury. “I find it interesting to see that photos of me prompt more profile visits but homeware shots get a lot of saves. Then I use the information to plan my future content but it’s also important to keep experimenting as there’s so many variables to play with.”
“I find it interesting to see that photos of me prompt more profile visits but homeware shots get a lot of saves. I use the information to plan my future content.” – @iamkristabel
What Instagram stats can you see?
Instagram Insights offers up plenty of metrics to monitor. There’s three sections: Activity, Content, Audience. You can also look at the numbers behind specific posts and stories. So without further ado, let’s break down what you can access here…
#1 Activity
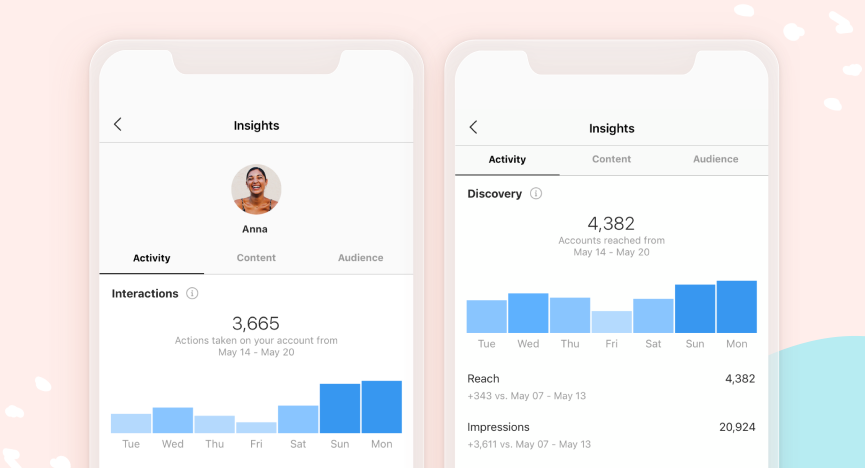
Under the Activity tab, you’ll find weekly interactions, reach, and impressions. This is helpful in understanding your influence and how people interact with your content.
Interactions: This subsection shows all actions taken on your profile in the current week. It includes total number of profile views and the number of times visitors have clicked the link in your bio. As you know, the #linkinbio is hugely valuable (the Milkshake app is here to help with that!) so tracking how many click-throughs you generate is really handy.
Discovery: The next subsection displays a graph of your influence over the past seven days. The first metric is Reach, which is the number of unique accounts who have seen any of your content. Secondly, Impressions tells you the number of times your content was served to Instagram users. This can be amped up by posting at peak times, running Insta ads and choosing relevant hashtags (we have a lesson on that BTW).

#2 Content
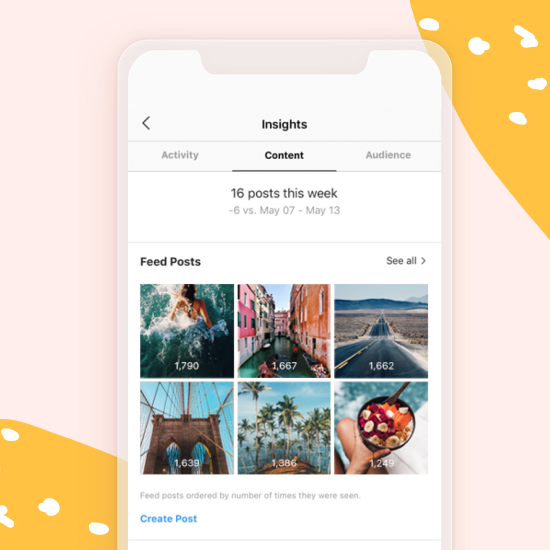
Now you’ve delved into overall performance, this tab digs deeper into individual content. It’s a great way to see what posts are working well, including videos, stories and promotions.
Posts: Here you’ll see how many posts you’ve shared this week vs the previous week. This section also reveals all grid posts in the past year sorted by engagement. It’s an easy way to see which of your posts has performed best in the past 12 months. Tap on one post and you’ll find the interactions it generated, how many accounts were reached (and what percentage weren’t following you), how many followers it led to and, brilliantly, the discovery of your post through hashtags, the home feed or your profile. There’s also the number of times it was saved as well, of course, the amount of likes and comments it received. Super interesting stuff.
Stories: Unsurprisingly, this subsection is helpful for shaping your future Story content. The info shows how users view and interact with your Stories over the past 14 days. Tap on one of your Stories and you’ll see the number of times your Instagram Story has been seen, the amount of actions taken from it and how many accounts you reached. It’s also useful to see the number of users who skipped this post or went onto the next Story, revealing your audience’s interest.
Promotions: Here you can see whether that ad you paid for is really working. The data is vital for knowing what type of posts are worth investing in, depending on what your goal is.

READ MORE: Photography tips from an Insta pro
#3 Audience
Getting to know your Insta audience is key for success. This section tells you who’s seeing and interacting with your posts with demographic breakdowns and details on the peak time to post. For starters, keeping track of how many followers you have this week in comparison to the previous week (yep, that means how many you’ve lost as well as gained) will show you when your content is strongest.
According to content creator @NerdAboutTown, “I use the Audience tab to see what days and times my followers are most likely to be online, then I’ll post a photo during that time for most engagement.” So what can you see?
Top locations: Here you can see the top five cities and countries where your followers are located.
Age range: Ever wondered how old your followers are? This is where you’ll find out.
Gender: In a simple piechart, Instagram shows the distribution of your followers separated by men and women.
Followers: This helpful statistic allows you to see the average time, as well as the days of the week, when your followers are on Instagram. It means you can plan to share content when your audience is most active. Bring on killer engagement!

And if I want to know more?
Aside from the many benefits, the downsides of Instagram Insights is there’s no desktop version, you can’t view older data, or download your results. So if you want extra features that the in-app analytics don’t offer, there are plenty of third-party options. Here at Milkshake, our favourites are Iconosquare, Keyhole, Socialbakers, Squarelovin and Union Metrics.
A Quick Recap
- Try focusing on one set of analytics at a time. Because, yes, that’s a lot of numbers to digest!
- Think about your goal. Maybe you want to drive more website visitors? Or perhaps you want to push sales? Knowing what you’re looking for when using Instagram Insights will refine your focus on the key stats.
- There’s no need for endless full-on reports. Just a quick, regular look at your analytics can instantly improve your IG game.
